Hello there.
Looking forward to tell you that we have made investments on three (3) different companies. All stocks are providing a well covered high dividend yield of + 10 %.
These stocks are suitable for medium-to-longterm hold. The companies have a strong position in the markets and strong cashlow. One of these companies is relatively young and one is founded all the way back in the 1871.
Stock prices have risen during the past 6 months, so obviously the entry prices are not the best they could be. With the elder stock (the one founded at 1871) the entry price is closing all-time-highs to be honest. However this is part of the long term plan.
The plan is to acquire more of these companies exactly when the prices drop further 20% - 30% if (read when) the bigger market correction shall take place in the global stock market in the near future. With these entries we are putting our money where out mouth is and keeping us in the loop for monitoring the development of these companies and performance of the stock prices.
These companies are familiar to some of you, but most likely something most of you have never heard of. So keep you eyes and ears open and let´s take a look at the Nordic energy sector, introducing company number one.
Fortum Inc.
Fortum [“FORTUM”] is a Nordic energy company and one of three biggest electricity provider in the Nordic region, together with Swedish Vattenfall and Statkraft from Norway. Fortum has a purpose to power a world where people, businesses and nature thrive together. The core operations in the Nordics comprise of efficient, CO2-free power generation as well as reliable supply of electricity and district heat to private and business customers.
Relevant ESG information states that 98% of power generatated energy is CO2-free. Financially wise at 2023 Fortum had 1,903 EUR million comparable EBITDA and 1,544 EUR million comparable operating profit.
Fortum produces and distributes clean energy and is one of the cleanest energy producers in Europe. That doesn´t really suprise as Finland, Sweden and Norway are known for clean nature and for having the best water qualityin the world, forming the most cleanest and nature-friendly countries existing.
Technical Analysis
Weekly timeframe:
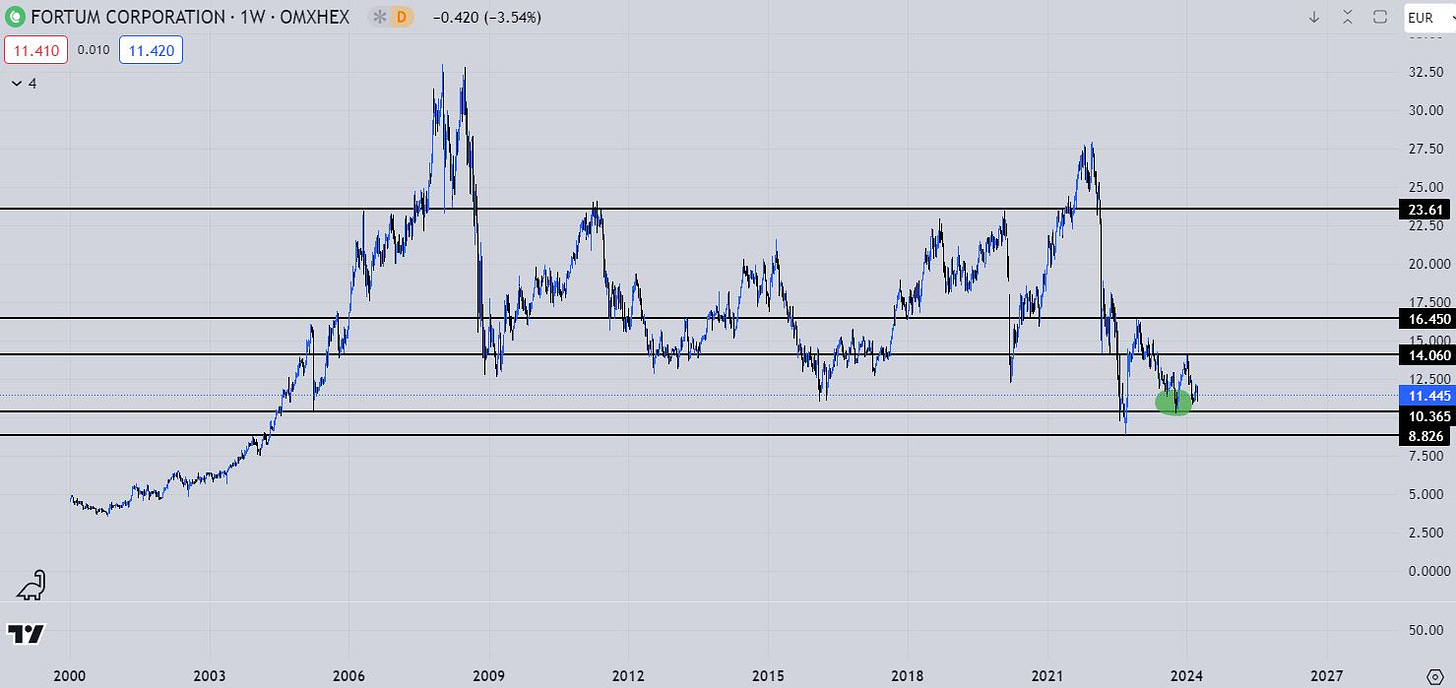
As you can observe from the weekly charts above, Fortum stock price is not that far from the 25 year-lows. Remember that Fortum operates at the energy sector and produces electricity. The modern world runs with electricity and the demand is ever-growing. If you think about it in contrary and upside down, the modern world would not perfrom without electricity. Even the largest ech companies included in the SP500 would have no use, basically. Therefore, it is likely that energy-producing companies shall remain and even further strengthen their position at the markets.
The green spot represent the entry zone the investment was made.
Daily timeframe:
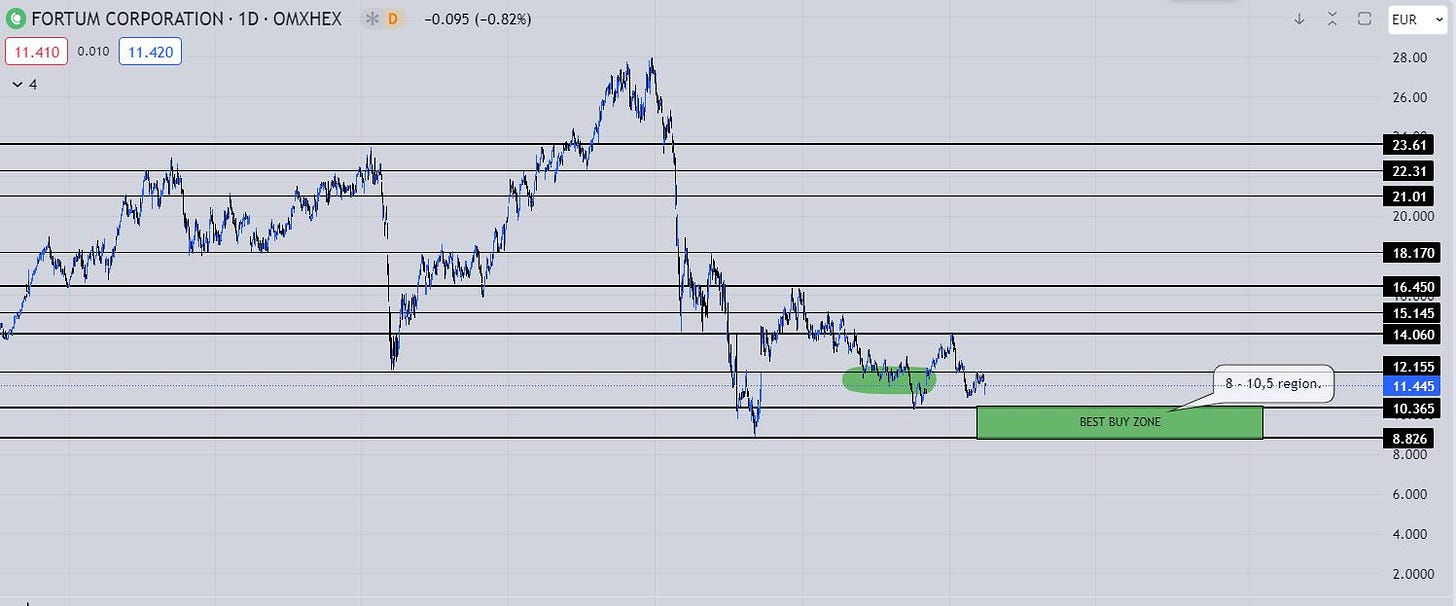
Now, pay close attention to daily charts below. They contain more valuable information that at first sight you might think of.
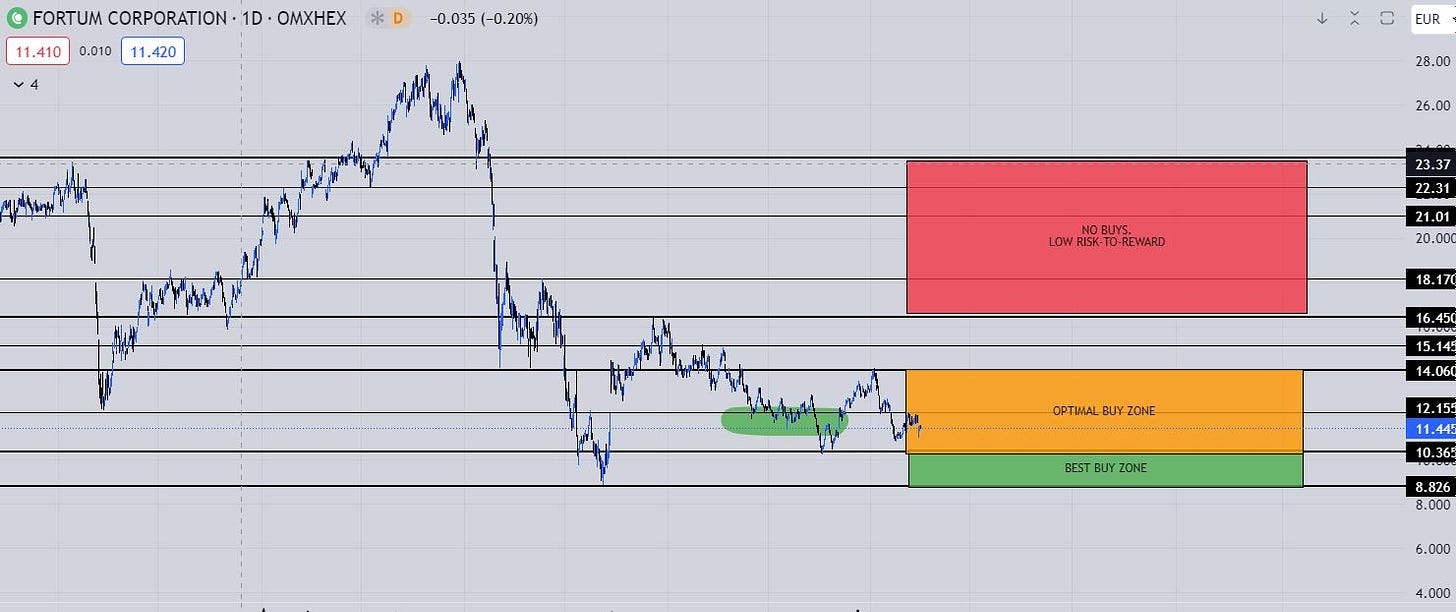
Green spot indeed represent the entry zone the investment was made. The green square represents the best purchase/entry region you could have based on higher timeframes technical analysis.
Perhaps some of you is thinking: “Why then buy at higher price at all, instead of waiting the price to reach the Best Buy Zone? Especially when the price seems to be in a slight downtrend towards the Best buy Zone?”
Simply because of two things:
Firstly, we do not know what will happen in the markets. History is not a guarantee of furute price action.
Secondly and more importantly, the investment for a slightly higher price than the Best Buy Zone is directly based on concept of having skin in the game. By having skin in the game you are more likely to stay in the loop for markets and follow certain sectors and price developments of certain companies.
It is better to take an entry and wait for posbbile re-entries instead of waiting in the sidelines without guarantees. With this decision we have already confirmed our dividends which also cover the broker transaction costs easily in full. Remeber the statement from above: “The plan is to acquire more of these companies exactly when the prices drop further 20% - 30% if (read when) the bigger market correction shall take place in the global stock market in the near future. “
Above chart tells more than a thousands words. Look at it closely and within a moment you notice the relevant zones for the price development. Suddenly the entry price at the green sport does not seem that bad, espacially, if re-entries are made 10 - 20 % lower.
4H timeframe:
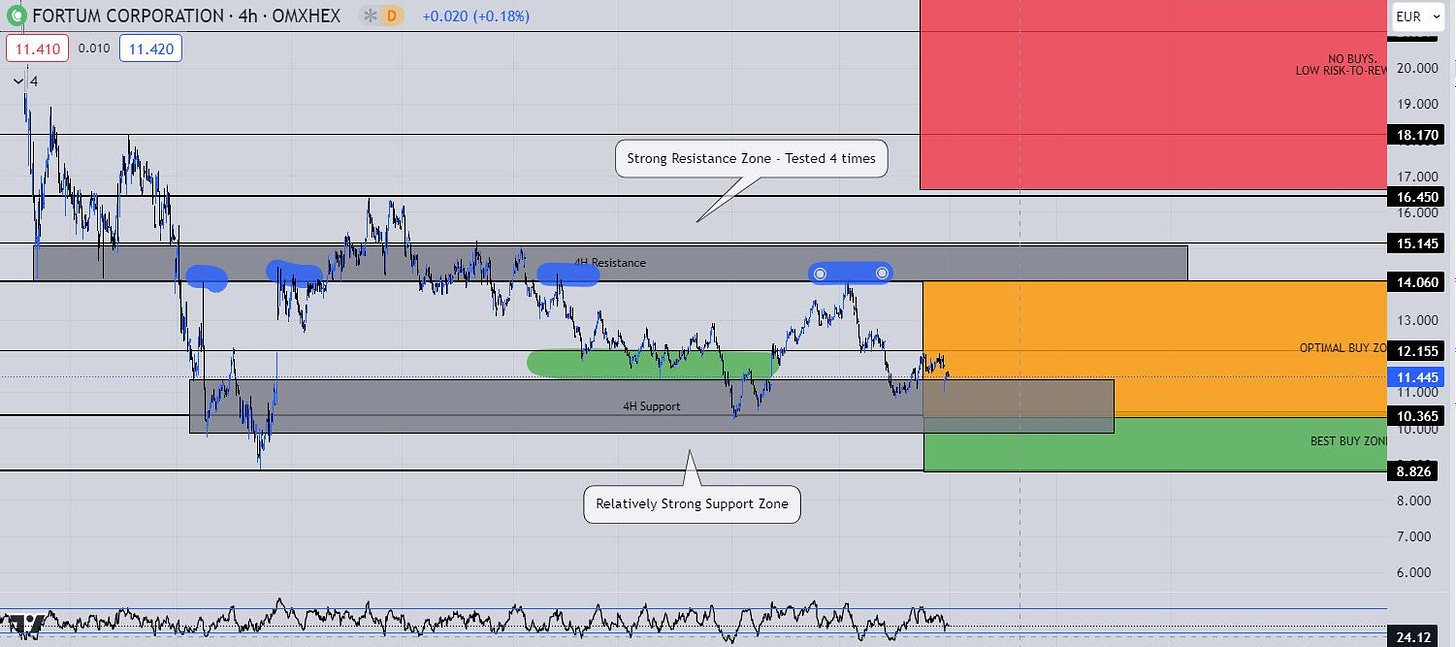
Now a more closer look at the 4H timeframe. Here you can notice that the price has retested the 4H resistance zone for 4 times (blue spots) and the resistance has held, notwithstanding a short visit above the resistance zone. 4H Support zone blends as one zone together with Best Buy and Optimal Buy Zones around 10.2 - 11 price region.
The Investment
An investment of 1.170 euros @ 11.70 stock price equals at 100 pieces of Fortum stocks. The investment was made with 9-5 income. The investments provides a high 10 % dividend yield of 1.15 euros, payable twice during 2024. This investments adds up the portfolio annual dividend income with 115 euros. However, it is likely that dividend yield shall not remain as high, although the sector most likely shall keep up distributing dividends to shareholders.
And that´s a Wrap!
I really hope you liked the structure of this edition. These editions are developing and going more in-depth one by one. If you take a look at the library from months back you see the difference right away.
I would be thankful and appreciate if you would Share this Edition if you think anyone else could receive value from it. Subscibe to learn more on technical analysis and building stock portfolios while working 9-5!
Thank you for being here


